How to create your first Flux agent
A ten-minute walkthrough for anyone who has never written a trading rule.
October 11, 2026 · 8 min read
Most people who try algorithmic trading give up before they place a single trade. The tools assume you can code, and the vocabulary assumes you've done it before. Flux works the other way round. You describe an idea in plain words, and it turns that idea into rules you can read, test and run.
This guide builds one real agent from start to finish, with a screenshot of every step. It uses Indian stocks (the Nifty 50), and it works the same way for US stocks.
First, what is a Flux agent?
A Flux agent is a set of trading rules that runs on its own. Something like: "Buy the two strongest stocks each week. Sell any that fall 6%."
AI helps you write the rules. It doesn't place the trades. Once your agent is running, it follows your rules exactly, every time, with no hunches and no panic selling. If you'd rather have an AI make each decision for you, that's what our other agent, Cortex, is for.
Everything starts on paper money: ₹1 crore of virtual cash in India, or $100,000 in the US. Nothing real is at risk.
Step 1Choose Flux
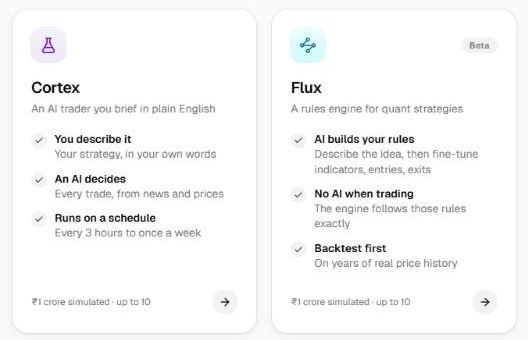
Click New Agent and pick Flux.
Step 2Pick a universe
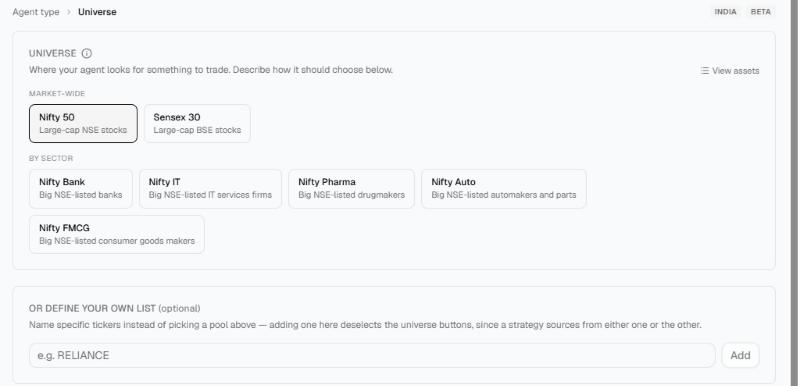
The universe is the list of stocks your agent is allowed to choose from. It never looks outside it.
The Nifty 50, India's 50 largest companies, is a good first choice. The sector lists (Bank, IT, Pharma, Auto, FMCG) are narrower, and you can also type in your own tickers. We'll use the Nifty 50.
Step 3Describe your idea
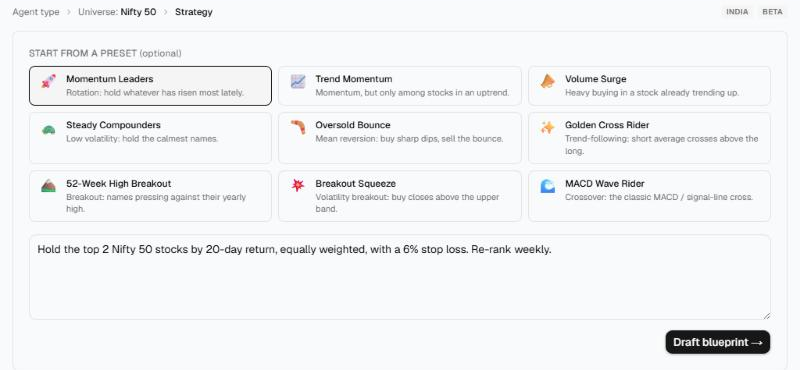
You can write your idea in your own words, or start from a preset. Each preset is a well-known strategy, already tuned for the universe you picked.
We chose Momentum Leaders:
Hold the top 2 Nifty 50 stocks by 20-day return, equally weighted, with a 6% stop loss. Re-rank weekly.
Here is what that means:
- 20-day return: how much a stock has gone up over the last 20 trading days, about a month.
- Top 2, equally weighted: it holds the two biggest risers, with half the money in each.
- 6% stop loss: if a stock it owns falls 6% below what it paid, it sells. This limits what one bad pick can cost you.
- Re-rank weekly: once a week it checks again and swaps out anything that is no longer in the top 2.
Click Draft blueprint.
Step 4Chat to adjust it
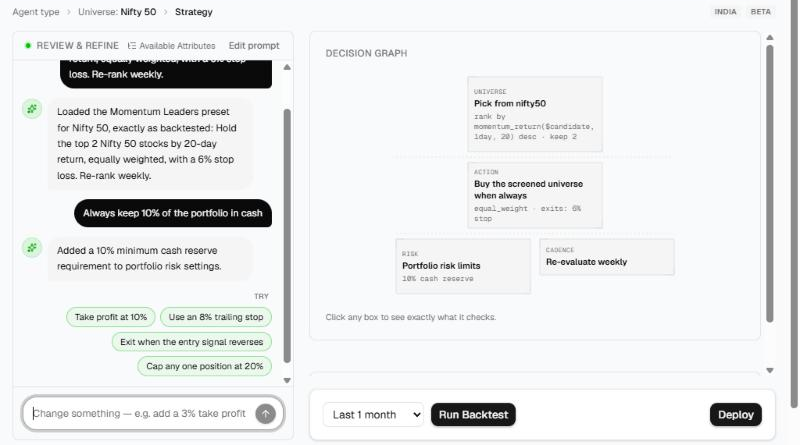
Your strategy now appears as a conversation on the left and a diagram on the right. To change something, just say it.
We wanted a cushion, so we typed "Always keep 10% of the portfolio in cash." The agent confirmed the change, and a new Risk box appeared in the diagram.
A few tips:
- Make one change per message, so each one is easy to check.
- Be specific. "Sell if it drops 8%" works better than "be more careful".
- The green buttons under the chat are common tweaks. Click one to try it.
Step 5Check the graph
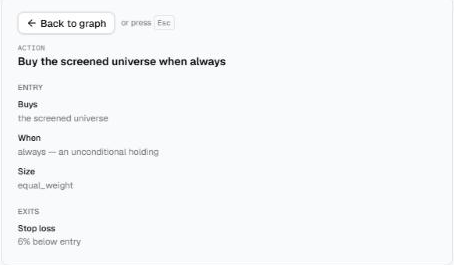
The decision graph is your strategy, drawn out. Each box is one part of it:
- Universe: which stocks it looks at, and how it ranks them.
- Action: what it buys, how much, and when it sells.
- Risk: limits on the whole portfolio, like the cash cushion.
- Cadence: how often it checks.
Click any box to read exactly what it does. The Action box above says: buy the selected stocks in equal amounts, and sell any position that falls 6% below what it paid.
Read every box before you go further. If something isn't in the graph, your agent won't do it.
Step 6Backtest it
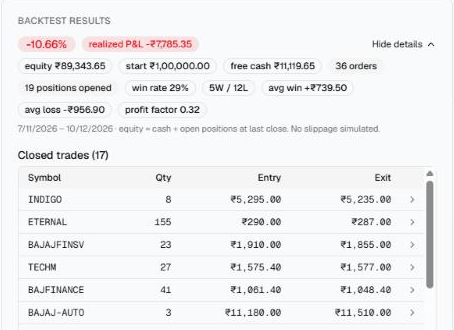
A backtest runs your rules on real past prices, as if your agent had been trading all along. It's the cheapest way to find out whether an idea holds up.
Pick a window (we used the last 3 months) and click Run Backtest. It takes a minute or two.
Ours lost 10.7% over those three months. It made 17 trades: 5 winners and 12 losers. We kept this example on purpose. Finding a weak spot with old prices costs nothing. Finding it with your own money does.
What the numbers mean:
- Win rate: the share of trades that made money. Ours was 29%.
- Average win and average loss: how much a typical winner made, next to how much a typical loser lost.
- Profit factor: total gains divided by total losses. Above 1 means it made more than it lost. Ours was 0.32.
Click any trade to see when it bought, when it sold and why.
If you don't like the result, go back to the chat. Try a longer window, a different stop loss or another preset, and run it again. Keep in mind that a backtest shows the past, not the future, and it doesn't include trading costs.
Step 7Deploy it and watch it paper trade

When you're happy with it, click Deploy, give your agent a name and confirm. We called ours Nifty Momentum.
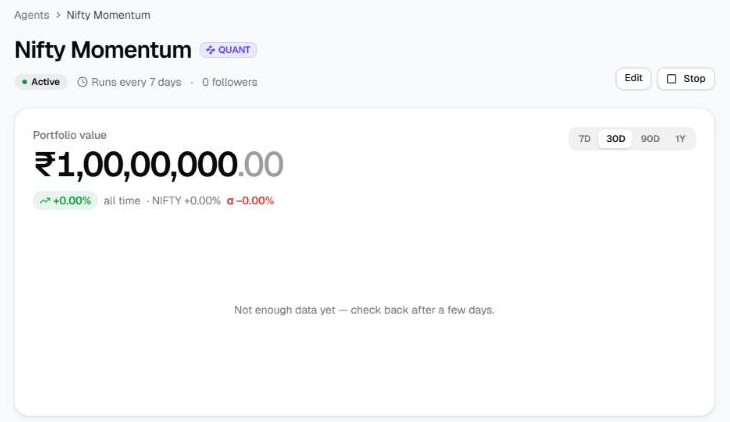
Your agent now runs on its own with ₹1 crore of virtual money. It only trades while the market is open and checks on the schedule you set (weekly, for ours). Every trade shows up on its page and in your feed, with the reason it was made. Its value is tracked against the NIFTY 50, so you can see at a glance whether it's beating the market.
You can edit or stop it at any time. It's paper money, so there's nothing to lose while you learn.
Before you start
- Start simple. One idea, a few rules. You can always add more later.
- Give it time. A week of results tells you very little. A few months tells you more.
- Compare it with the index. Making 5% while the market made 10% isn't a win.
Nothing here is investment advice. Paper trading results are simulated, and past performance doesn't predict future returns.
It's free, and you don't need a card.